“Pay Versus Performance” Disclosures in the Technology and Life Sciences Sectors
Download a pdf of this article »
As we begin to move towards the end of 2023, we have taken a closer look at the newest executive compensation disclosure item appearing in proxy statements for the first time this year – the “pay-versus-performance” table and related information. Mandated by the Dodd-Frank Wall Street Reform and Consumer Protection Act, beginning with definitive proxy statements filed for fiscal years beginning on or after December 16, 2022, reporting companies (other than foreign private issuers, registered investment companies, and emerging growth companies) are required to:
- Present in tabular form specified compensation information about their named executive officers (“NEOs”) and financial performance for their five most recently completed fiscal years (three years in the initial year of compliance);
- Provide a clear description of the relationships between each of the financial performance measures included in the required table (the “Pay-Versus-Performance” table) and the executive compensation actually paid (“CAP”) to their Chief Executive Officer (“CEO”) and, on average, their other NEOs, along with a description of the relationship between their total shareholder return (“TSR”) and their peer group’s TSR; and
- Provide a list of three to seven financial performance measures that the company determines are its most important measures used to link the CAP to its NEOs, for the most recently completed fiscal year, to company performance.
As described below, “smaller reporting companies” (“SRCs”) are eligible to comply with scaled disclosure requirements, including providing the tabular disclosure for only their three most recently completed fiscal years (two years in the initial year of compliance).
For a detailed discussion and analysis of the “pay-versus-performance” disclosure rule, please see our Thoughtful Pay Alert, SEC Adopts New Rules for “Pay Versus Performance” Disclosure Requirement (Sept. 9, 2022).
This Thoughtful Pay Alert summarizes our findings based on a review of the definitive and/or preliminary proxy statements filed through September 15, 2023 by over 200 technology and life sciences companies headquartered in the United States.
Companies Reviewed
We conducted an analysis of 215 technology and life sciences companies that filed their proxy statements between March 15, 2023 and September 15, 2023, as follows:

In addition, of the companies that were not SRCs, 22 companies disclosed that they did not use any financial performance measures in their short-term incentive compensation plan and granted only time based equity awards (or only used financial performance measures that were already included in the “Pay Versus-Performance” table). Consequently, these companies did not include a Company-Selected Measure (“CSM”) in their “Pay-Versus-Performance” table, describe the relationship between the CAP to their NEOs and a CSM, and provide a Tabular List (as discussed below), 14 of which were technology companies and eight of which were life sciences companies.
Presentation Considerations
Location of Disclosure
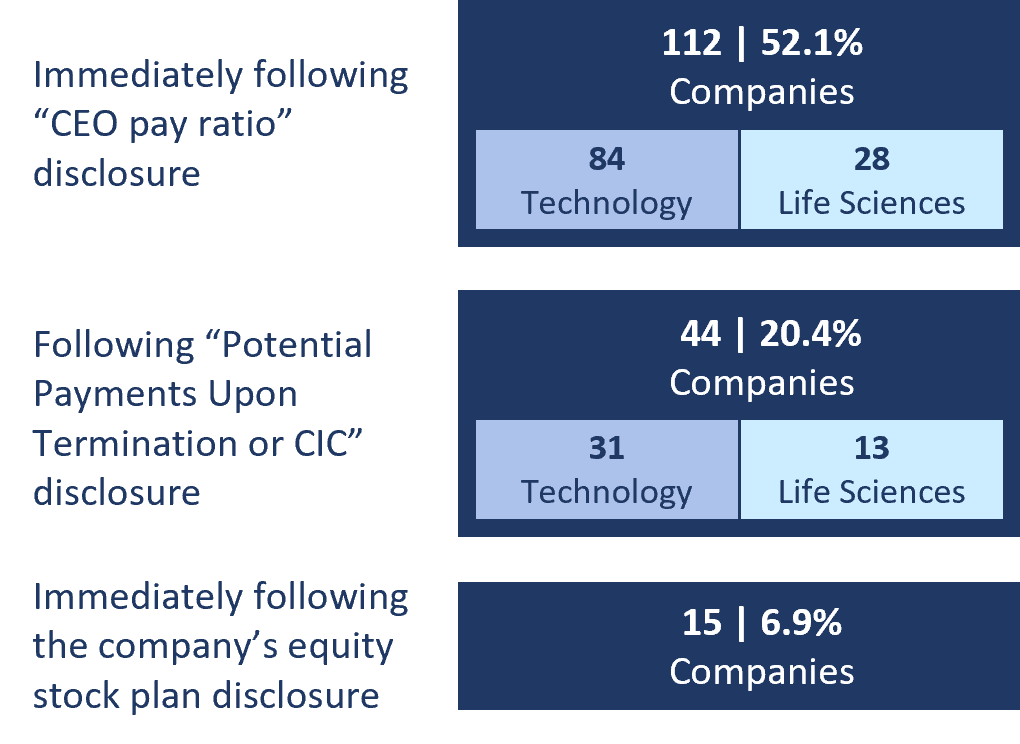
While the “pay-versus-performance” rule does not specify where the required disclosure should be located in the proxy statement, we found that most of the reviewed companies (52.1%) inserted the new disclosure immediately following their “CEO pay ratio” disclosure. The second most common location (20.4%) was following the required “Potential Payments Upon Termination or Change in Control” disclosure. The only other location that registered double digits was immediately following the company’s equity stock plan disclosure (the disclosure required about the number of shares available for issuance under employee stock plans both approved by shareholders and not approved by shareholders) (6.9%).
Location of “Pay-Versus-Performance” Disclosure
Length of Disclosure
We found that the average length of the disclosure was four pages, with the longest disclosure being 10 pages and the shortest disclosure being one page, each at one company.
Cross-Reference to Compensation Discussion and Analysis (“CD&A”)
Given the nature of the pay-versus-performance disclosure – the link between pay and performance – most companies provided either a general reference to their CD&A or a cross-reference to a specific section of their CD&A where such a discussion was located for more information on how the company correlated its executive compensation to its business performance (73.0% (157 companies)), including 120 technology companies and 37 life sciences companies.
Tabular Disclosure
The required “Pay-Versus-Performance” table contains two distinct sections: information on compensation paid to a company’s NEOs and information on prescribed financial performance measures – both essential to the required disclosure of the relationship between the CAP to their CEO and, on average, their other NEOs and the company’s financial performance. For most companies, the most challenging aspect of preparing the “Pay-Versus-Performance” table involved the computation of the adjustments to the amounts reported for their NEOs in the Summary Compensation Table (“SCT”) for each covered fiscal year, which principally involved the recalculation of the fair values of the equity awards granted or vested during each covered fiscal year as of each vesting date and outstanding at the end of each covered fiscal year as well as any equity awards granted in prior fiscal years that vested during and/or were outstanding at the end of each covered fiscal year.
Reconciliation of CAP
In addition to the CAP amounts reported in the “Pay-Versus- Performance” table, companies were required to include a footnote to the table providing a reconciliation between the reported SCT amounts and the CAP amounts disclosed in the table. All but four of the technology companies (154 companies) and all but one of the life sciences companies (56 companies) we reviewed provided this information using a “reconciliation table” format that, for the CEO and, on average, for the other NEOs, set out the amounts deducted from and added to the “total compensation” reported in the SCT to produce the required CAP figures.
Valuation Assumptions
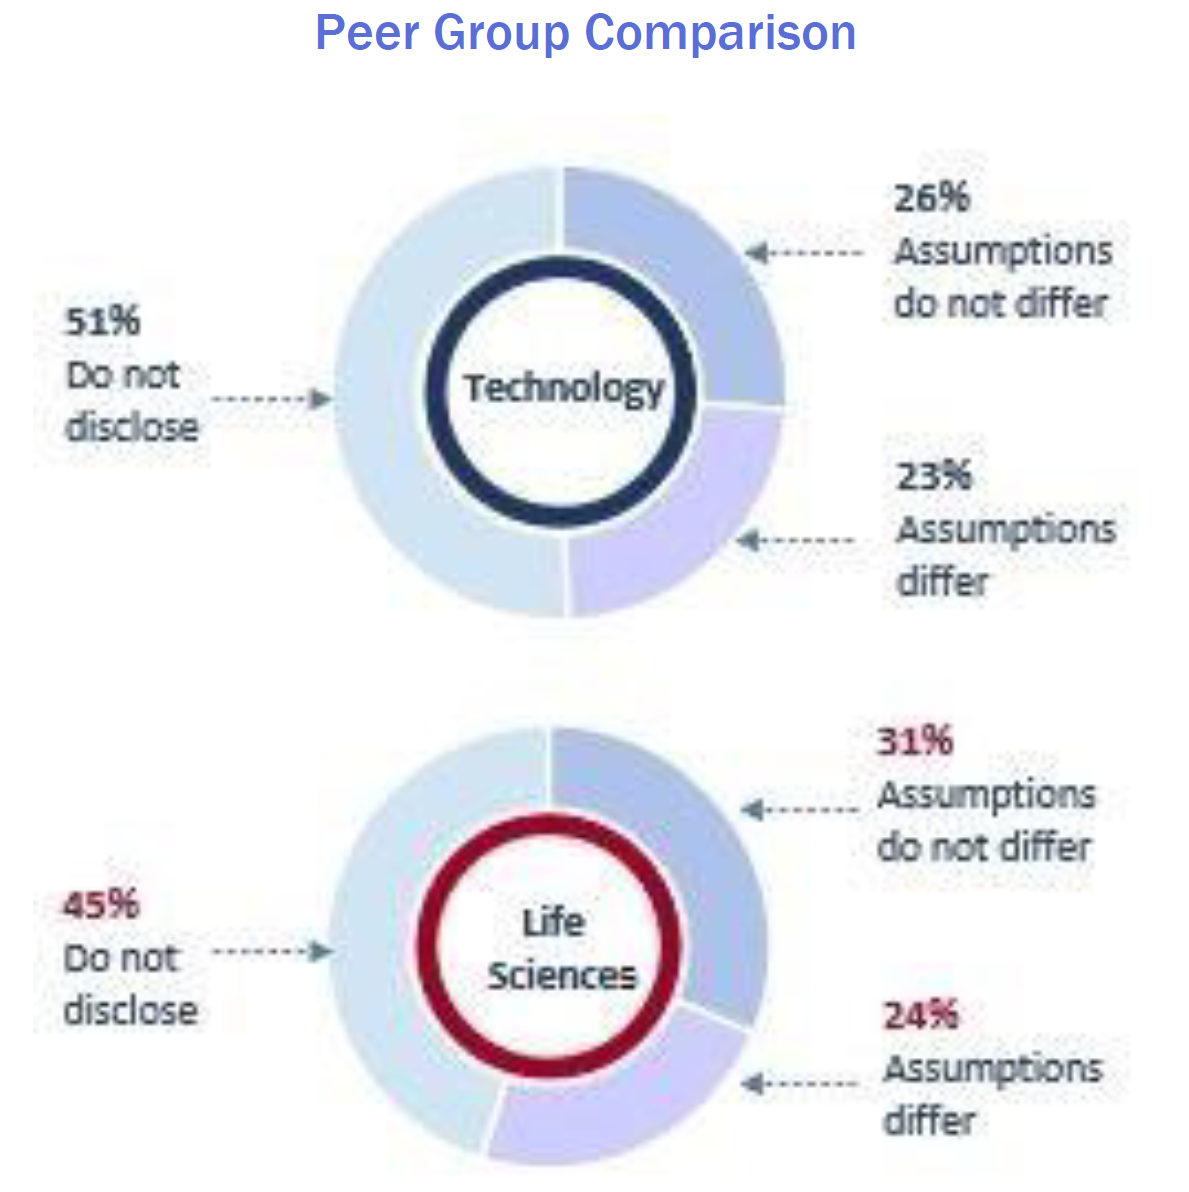
If the assumptions used to recalculate the fair value of equity awards for purposes of computing CAP materially differed from those disclosed at the time of grant of such equity awards, companies were required to include a footnote to the table disclosing such assumptions. We found compliance with this requirement to be somewhat mixed among the reviewed companies. Just over one-quarter of the reviewed companies (27.4% (59 companies)), including 43 technology companies and 16 life sciences companies, expressly disclosed that the assumptions used to compute CAP did not materially differ from their grant date fair value assumptions. In view of the SEC Staff’s recent interpretive guidance on the disclosure of any material changes to the valuation assumptions from those disclosed at the time of grant (see Compliance and Disclosure Interpretation Question 128D.22), it is not clear whether this conclusion was based on a review of the specific inputs used in the valuation methodology or whether a different valuation framework was used.
An additional 23.3% (50 companies), including 38 technology companies and 12 life sciences companies, disclosed that different assumptions were used to compute CAP, with 23 companies providing the updated assumptions in the footnote itself, while 12 companies simply cross-referenced the footnote in their Annual Report on Form 10-K which disclosed their equity award assumptions. Finally, a significant number of the reviewed companies (49.3% (106 companies)), including 83 technology companies and 23 life sciences companies, did not address the subject in their pay-versus-performance disclosure.
Valuation Assumptions

Peer Group TSR
For purposes of disclosing the cumulative TSR of their peer group for each covered fiscal year, companies were permitted to use either:
- the same published industry or line-of-business index (or if an index was not used, the identity of the companies comprising the group) that they used for purposes of preparing the performance graph to be included in their Annual Report to Shareholders or, more commonly, their Annual Report on Form 10-K; or
- the companies that they used as the compensation peer group for purposes of their CD&A.
Since the “pay-versus-performance” rule requires a company that uses a group of peer companies that differs from year to year (which frequently occurs in the case of compensation peer groups) to explain the reason for the change and compare the company’s cumulative TSR to that of both the newly-selected peer group and the former peer group, in our experience most companies opted to use the published industry or line-of-business index from their performance graph to satisfy this requirement.
We found that 94.5% of the companies we reviewed that were required to disclose peer group TSR (182 companies), including 75.2% of technology companies (137 companies) and 100% of life sciences companies (35 companies), chose to use a published industry or line-of-business index. Only 5.5% of the companies (all 10 of which were technology companies) used a compensation peer group. Since they were not required to do so, none of the 33 SRCs disclosed peer group TSR.
The most commonly used industry or line-of-business index for each sector were:
Of the companies we reviewed, all but 11 companies that used an industry or line-of-business index used the same index as used in their performance graph. In addition, we noted that several (a total of 18) of the companies using an index appeared to use a broad equity market index, rather than the narrower published industry or line-of-business index called for under the rule.
Company-Selected Measure
In addition to including their cumulative TSR and net income (or loss) for each covered fiscal year in the “Pay-Versus-Performance” table, companies (other than SRCs and companies that did not use any such measures in their executive compensation program) were required to select a single financial performance measure from their Tabular List (as discussed below) which, in their assessment, represented the most important financial performance measure (that was not otherwise required to be disclosed in the table) used to link the CAP to their NEOs, for the most recently completed fiscal year, to their performance.
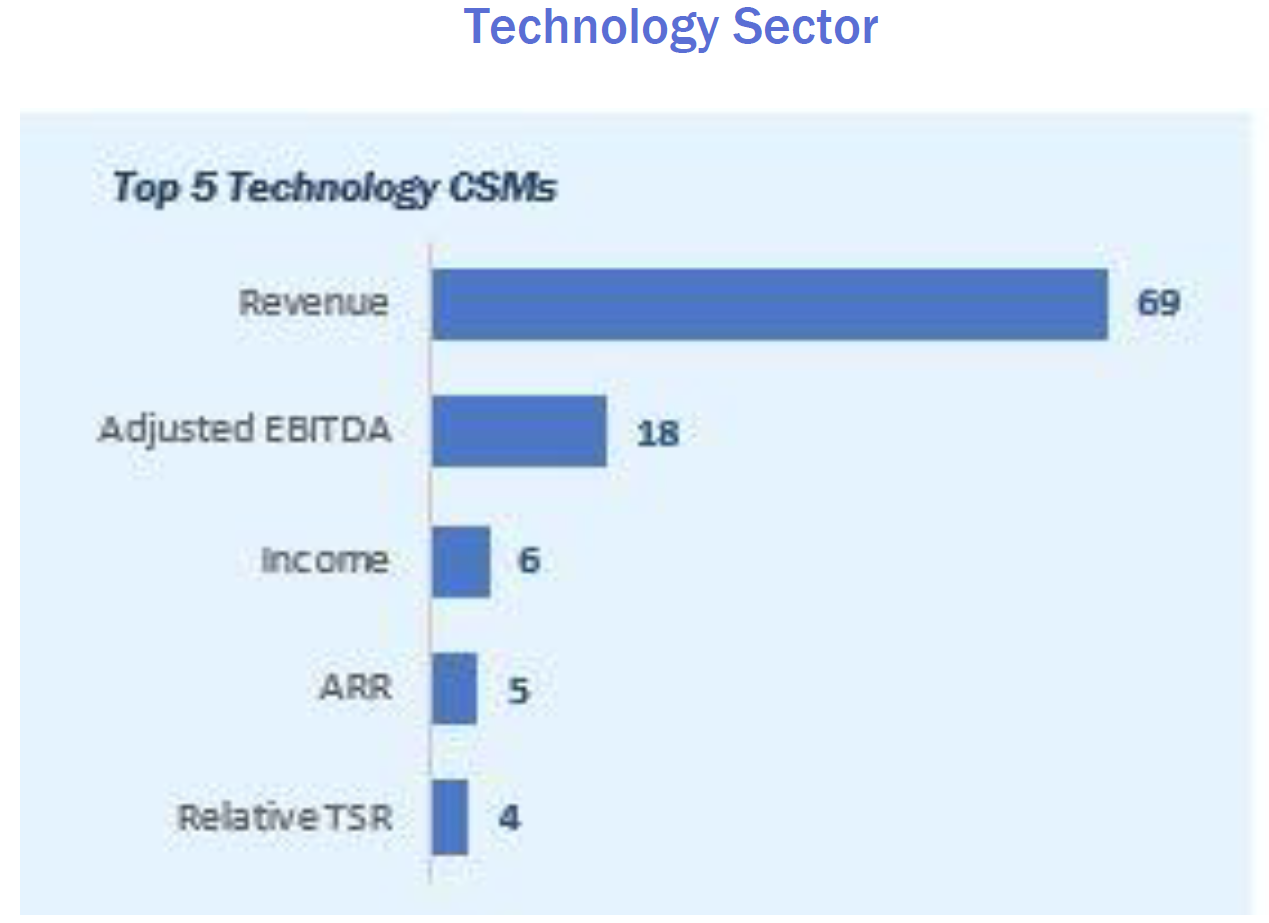
The most commonly disclosed CSM’s for each sector were:

Use of Non-GAAP Performance Measure
The “pay-versus-performance” rule permits the use of non-GAAP financial performance measures as a CSM. Of the 160 companies that we reviewed which disclosed a CSM, 18.8% (30 companies), including 28 technology companies and two life sciences companies, chose a non-GAAP financial performance measure as their CSM.
“Supplemental” Performance Measure
While the “pay-versus-performance” rule permits companies to provide additional financial performance measures in their “Pay-Versus-Performance” table, we found only six companies that did so in their initial disclosure. These financial performance measures ranged from revenue (or some revenue variant, such as annual recurring revenue) to adjusted EBITDA. The others were more specialized, and included “transaction value,” “adjusted contribution,” and “adjusted free cash flow.”
Observations: The “pay-versus-performance” rule permits a company to supplement the required disclosure with additional information (including in the “Pay-Versus-Performance” table) as long as it is not misleading and does not obscure the required information. Accordingly, it may be important for a company including an additional financial performance measure in its “Pay-Versus-Performance” table to note which of these measures is to be considered its CSM and which is the supplemental measure since the rule appears to limit companies to a single CSM. Any supplemental financial performance measures must be clearly identified as supplemental, not misleading, and not presented with greater prominence than the required disclosure. For example, depending on the facts and circumstances, a company could use a heading in the “Pay-Versus-Performance” table indicating that the disclosure is supplemental, or include language in the text of its filing stating that the disclosure is supplemental.
As previously noted above, to the extent additional financial performance measures are included in the “Pay-Versus-Performance” table, they must also be accompanied by a clear description of their relationship to the CAP to the company’s NEOs. We note that each of the companies providing a supplemental financial performance measure included the measure as part of its relationship disclosure.
Relationship Disclosure
In the view of many observers, the crux of the new “pay-versusperformance” disclosure is the company’s description of the relationship between each of the financial performance measures included in the “Pay Versus-Performance” table and the CAP to their CEO and, on average, their other NEOs. This is the section of the disclosure where we saw the greatest variability in approaches to providing this information.
Form of Relationship Disclosure
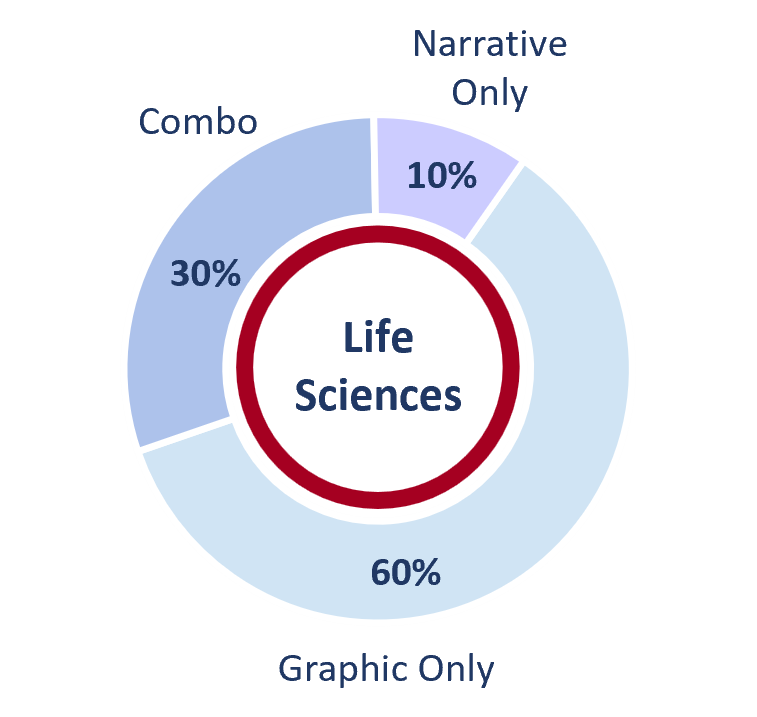
The vast majority of the descriptions provided to satisfy this disclosure requirement were presented graphically – 114 companies. Of these, 89.5% were technology companies (102 companies) and 10.5% were life sciences companies (12 companies). Another 36 companies used a combination of narrative and graphical disclosure to discuss this relationship (30 technology companies and six life sciences companies). Only eight of the technology companies and two of the life sciences companies that were reviewed provided this information entirely in narrative form.

Observations: We noted that 74.4% of the companies (119 companies) that were required to disclosure peer group cumulative TSR “doubled up” the required relationship description of CAP and their cumulative TSR and the relationship description of their cumulative TSR and peer group cumulative TSR; using a single graphic to provide both required descriptions. In total, this included 78.2% of the technology companies (93 companies) and 21.8% of the life sciences companies (26 companies). We also noted several companies that used the same approach with their CSM – particularly where they provided a supplemental measure to the financial performance measure required in the “Pay-Versus-Performance” table.
Tabular List of Important Financial Performance Measures
Under the “pay-versus-performance” rule, reporting companies (other than SRCs and companies that did not use any financial reporting measures) were required to include a “Tabular List” of the most important financial performance measures used by the company in setting pay-for-performance compensation for the most recently completed fiscal year. This list was to include at least three, but not more than seven, financial performance measures in no particular order or rank. If a company considered only two or fewer financial performance measures when assessing pay-for-performance compensation, the company need only include in the list the measures actually considered (which may be zero). Further, in addition to the financial performance measures, a company could include non-financial performance measures (that is, operational performance measures) in the list if such measures were among its most important performance measures as long as it had disclosed its most important three (or fewer) financial performance measures.
Number of Performance Measures on Tabular List
While companies are permitted to disclose up to seven financial performance measures in their Tabular List, we found that most of the companies we reviewed 65.0% (103 companies), including 83 technology companies (80.5%) and 20 life sciences companies (19.5%), disclosed three or fewer measures, with 36 companies disclosing only one or two measures.
Companies Disclosing Non-Financial Performance Measures
Of the companies we reviewed, 21.9% (35 companies), including 26 technology companies (74.3%) and nine life sciences companies (25.7%), disclosed one or more non-financial performance measures in their Tabular List.
Observations: In our examination, we noted very few companies (in either sector) that included a list of more than five financial (and other) performance measures. Five companies disclosed six measures and one company disclosed eight. None of the companies we reviewed disclosed seven performance measures.
Most companies simply included three measures, including the CSM, or perhaps one or two additional non-financial performance measures. We saw a few companies provide explanations of the measures listed (typically where the measure might otherwise be unfamiliar to some investors), but the vast majority simply included the required list. Going forward, we believe that it may be helpful to shareholders to describe how any unusual financial measures are calculated and/or to describe the methodology used to track a non-financial performance measure (although we recognize that such information is not required).
Other Notable Disclosures
Adjusted Pension Value
In addition to recalculating the fair values of outstanding equity awards to compute CAP for purposes of the “Pay-Versus-Performance” table, if a reporting company maintained one or more defined benefit or actuarial pension plans for its NEOs, it was required to replace the aggregate change in the actuarial present value of each NEO’s accumulated benefit under such plans with the sum of the service cost attributable to services rendered during each covered fiscal year and certain additional amounts if the plan was amended during a covered fiscal year. Since most technology and life sciences companies do not offer defined benefit pension plans to their employees, we only identified three companies that were required to make and disclose this adjustment when converting the total compensation amount in their SCT to CAP.
Smaller Reporting Companies
As previously noted, SRCs are subject to scaled disclosure requirements under the “pay-versus performance” rule. Initially, SRCs need only provide a “Pay-Versus-Performance” table for the two most recently completed fiscal years (which expands to three fiscal years in 2024). In addition, SRCs were not required to account for the Adjusted Pension Value in computing CAP for their NEOs, report in the “Pay-Versus-Performance” table either peer group cumulative TSR or a CSM or include a Tabular List of important financial performance measures. Each of the SRCs we examined took full advantage of these “scaled” disclosure requirements.
Observations: Given the novelty of the new disclosure, we recommended to our clients that, if applicable, they include a statement at the beginning of their “pay-versus-performance” disclosure to indicate their SRC status, thereby explaining why their disclosure was abbreviated from that of regular filers. We also recommended comparable disclosure to our clients which did not use any financial performance measures during the last completed fiscal year to explain why they were not providing a CSM, a description of the “pay-versus-performance” relationship for that financial performance measure, or a Tabular List. These statements served to both alert investors, their advisors, and regulators as to the reason for the abbreviated disclosure.
General Observations
Of the various executive compensation disclosure rules introduced by the Dodd-Frank Act, the “pay-versus-performance” disclosure requirement is one of the most complex – both in terms of compliance and the actual information contained in the disclosure itself. While the SEC Staff resolved several of the initial compliance challenges through the issuance of Compliance and Disclosure Interpretations in February 2023 and through addition interpretations issued at the end of September, numerous questions remain as to how the required disclosure is to be prepared and presented. As a result, the initial disclosures varied significantly in terms of the detail of information that was provided and what constituted an acceptable presentation format. We anticipate that the SEC Staff, having closely reviewed the initial round of disclosures, may consider issuing further clarifications and enhancements before companies begin preparing their 2024 disclosures. In addition, the major proxy advisory firms and larger institutional shareholders may issue their own commentary on the value and utility of the new disclosure. Finally, companies may now examine the various approaches taken by their peers and other comparable companies and decide whether to make any changes to or refine their disclosure. Consequently, while the second year of compliance should be somewhat easier than this year now that companies are familiar with the intricacies of compliance, we may see noticeable enhancements in next year’s disclosure as companies process this feedback and determine how best to coordinate this information with the “pay for-performance” analyses that is an important component of their CD&As.
We also note that, as anticipated, the CAP computation turned out to be the most time-consuming aspect of the new rule. Where a company regularly granted stock options to its NEOs with monthly vesting conditions, it was often necessary to make numerous (sometimes dozens of) calculations to complete the appropriate adjustments for purposes of determining CAP. While several companies that include such stock options as part of their long-term incentive compensation programs are discussing whether to modify their option programs to move to quarterly or annual vesting, at the present time there has been no widespread movement in this direction. Nonetheless, we expect that some companies are likely to make this change and/or to continue to shift away from stock options to full value share awards (such as RSUs) if they conclude that, on balance, the advantages of shorter vesting cycles isn’t sufficient to offset the compliance burden.
Need Assistance?
Compensia has extensive experience in helping companies analyze the requirements of the SEC’s “pay versus-performance” disclosure rule, as well as drafting the required disclosure. If you would like assistance in preparing your “pay-versus-performance” disclosure, or if you have any questions on the subjects addressed in this Thoughtful Disclosure Alert, please feel free to contact the authors of this Alert, Mark A. Borges at 415.462.2995 or mborges@compensia.com, Nina Jattana at 408.540.6142 or njattana@compensia.com, or Hannah Orowitz at (332) 867.0566 or horowitz@compensia.com.
About Compensia:
Compensia, Inc. is a management consulting firm that provides executive compensation advisory services to Compensation Committees and senior management.