
Equity Utilization in the Bay Area Tech 120
While equity compensation is a fundamental component of most technology company compensation programs, balancing the tension between fostering an ownership culture (which serves as a direct link between pay and performance) and managing shareholder dilution can be an ongoing challenge. Further, in recent years, institutional shareholders and their advisors have tightened their scrutiny of share requests for employee stock plans, making it more difficult for companies to “thread the needle” between what shareholders will approve, the need to both fund growth and provide meaningful incentives to executives and other employees, and the pressure of the competitive environment for key talent.
Recently, we examined the equity utilization practices at the most prominent technology companies headquartered in the San Francisco Bay Area (primarily in Silicon Valley). We call this group, which consists of companies in the computer/hardware, software/internet, and semiconductor sectors, the Bay Area Tech 120. The companies comprising the Bay Area Tech 120, which are listed in the Exhibit B to this article, report annual revenues ranging from $50 million to more than $3 billion (including seven companies with revenues in excess of $25 billion) and have been publicly-traded companies for at least three years.
This Thoughtful Pay Alert summarizes our findings as of January 31, 2017, based on the annual financial statements of the Bay Area Tech 120 companies for fiscal years ended between December 2015 and November 2016. Specifically, we focus on four key measures of aggregate equity usage:
- Gross burn rate;
- Issued and total overhang;
- Shareholder value transferred (the “fair value” of equity awards granted as a percentage of market capitalization); and
Stock-based compensation expense.
In addition, we examine current practices related to one of the primary drivers of these measures – equity vehicles awarded. (The definitions of “burn rate” and “overhang” are provided in Exhibit A to this article.)
Aggregate Equity Utilization Practices (Gross Burn Rate and Overhang)
Gross Burn Rate
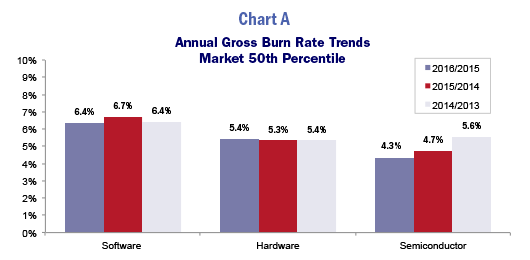
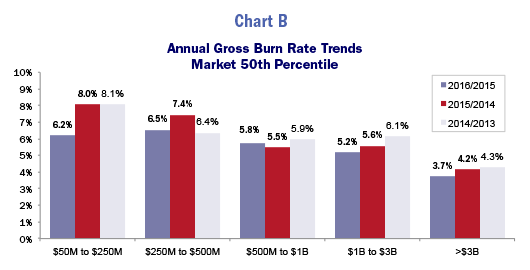
Overall, year-over-year burn rate levels among the Bay Area Tech 120 remained stable with only an average increase of 1% at the median. Notwithstanding this trend, there remain pronounced differences in equity usage depending on industry sector and company revenue size.
For the period reviewed, burn rate levels continued to decline among companies in the slower-growing semiconductor sector, while equity usage remained about the same in the software/internet and computer/hardware sectors (Chart A). For the past three years, software companies generated the highest burn rate levels given the sector’s focus on equity compensation in the overall pay mix and the pressure to stay competitive in the marketplace.
Burn rate levels are also correlated with company revenue size. Smaller companies that are growing more rapidly are “spending” more equity (~1.5x that of larger companies) to recruit and retain talent (Chart B). Cash compensation levels are often more modest as companies deliver a greater portion of compensation dollars in equity. Equity is used on a more targeted basis at larger companies to incent and reward employees rather than as a recruiting tool.
Issued and Total Overhang
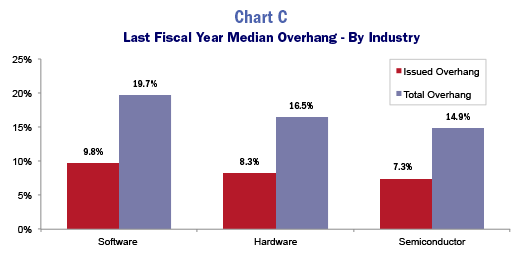
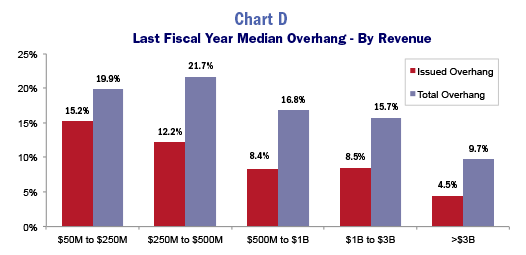
Overhang levels have declined in recent years, primarily due to smaller, more frequent equity compensation plan share requests and the movement away from stock options (Charts C and D). Outstanding stock options remain part of a company’s overhang until they are exercised or cancelled, which can be up to 10 years from the date of grant, depending on employee preferences (for example, how long an employee wants to hold the option prior to exercise) and stock market volatility. Conversely, full value share awards are removed from overhang once vested or earned, which generally is no more than four years from the date of grant.
Shareholder Value Transferred (“SVT”)
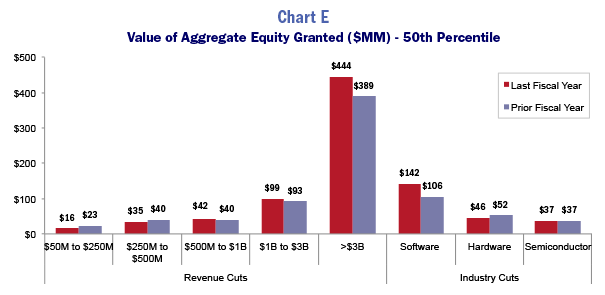
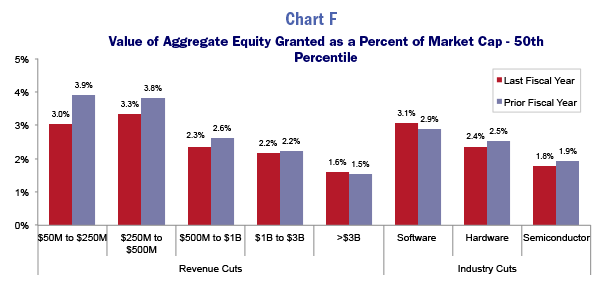
Burn rate and overhang measure shareholder dilution on a “number of shares as a percentage of company” basis. Another important measure of dilution is the value of the equity transferred from shareholders to employees through compensatory grants and awards. This measure is referred to as “SVT.” The dollar value of equity awards granted over the last two years varies significantly by company size and industry, but generally falls between 1.5% and 3.9% when calculated as a percentage of market capitalization. Our review of the Bay Area Tech 120 showed that, year-over-year, SVT generally held steady or dropped slightly (Charts E and F).
Stock-Based Compensation Expense
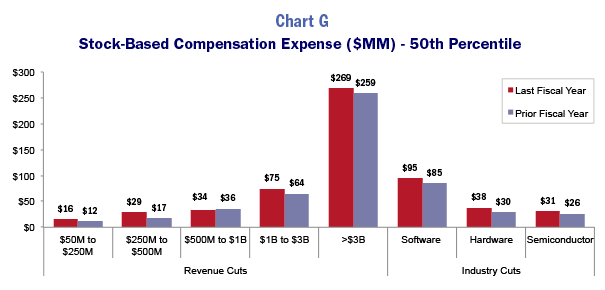
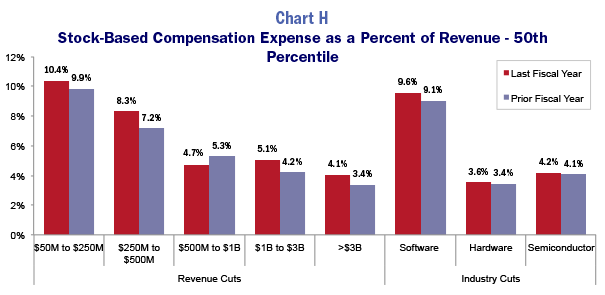
Technology companies have seen increased scrutiny of the dilutive impact of their equity grant practices (based on stock-based compensation expense), particularly where top line growth is slow or modest. This expense has increased year-over-year for most of the sectors and revenue groupings reflected in the Bay Area Tech 120 on an absolute dollars basis, but remained relatively consistent when measured as a percentage of revenue (Charts G and H).
Vehicle Practices
Stock option usage among technology companies continues to decline. In 2016, approximately 60% of the companies in the Bay Area Tech 120 granted options to their executives and/or key employees (down from 77% of the Bay Area Tech 120 companies two years ago). Reflecting their growing popularity, all but two of the Bay Area Tech 120 companies granted restricted stock unit awards. (Table A)
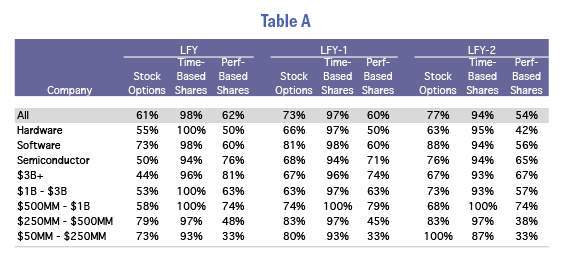
Performance share usage has steadily increased the last three years to 60% of companies, given pressures to strengthen the alignment of executive compensation with company performance. The trend is most visible among larger companies and companies in the software/internet and semiconductor sectors.
Final Observations
As a result of the close scrutiny of aggregate equity usage levels through the measures we have highlighted, as well as the heightened expectations about equity award design, companies have become much more sophisticated in their use of their equity awards to recruit, motivate, and retain their key executives and employees. This is being reflected in the shift away from stock options to full-value share awards (that is, restricted stock and restricted stock unit awards and performance share and performance share unit awards).
In addition, the recent revisions to the methodologies used by the principal advisors to the institutional investor community to evaluate employee stock plan proposals is beginning to cause a pronounced compression in the size of share requests overall. Now, more than ever, we expect companies to continue to monitor and manage their equity usage carefully to ensure that they are able to meet their growth plans, while, at the same time, maximizing the incentive value that such awards can readily provide.
About the Authors
The authors of this Thoughtful Pay Alert are Mark Borges, a principal at Compensia, and Jodie Dane, a Senior Consultant at Compensia. If you have any questions about this Thoughtful Pay Alert or equity utilization generally, Mark can be reached at 415.462.2995 or mborges@compensia.com
and Jodie can be reached at 415.462.1985 or jdane@compensia.com.
Need Assistance?
Compensia has extensive experience in assisting companies in designing and managing their employee stock plans, including navigating the expectations of institutional shareholders and their advisors about share usage. If you would like assistance in analyzing your employee stock plan strategy or negotiating the various pressure points in implementing an employee stock plan or a share reserve increase, or if you have any questions on the subjects addressed in this Thoughtful Pay Alert, please feel free to contact Jodie Dane or Mark A. Borges.
To view the Appendix, download a pdf of this article »